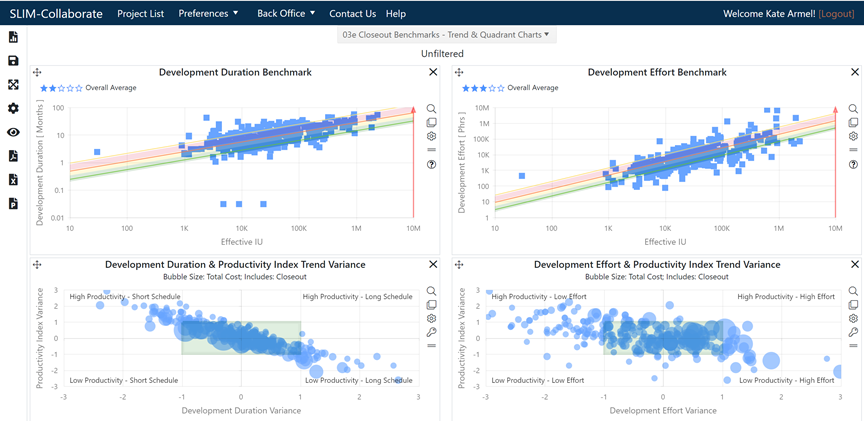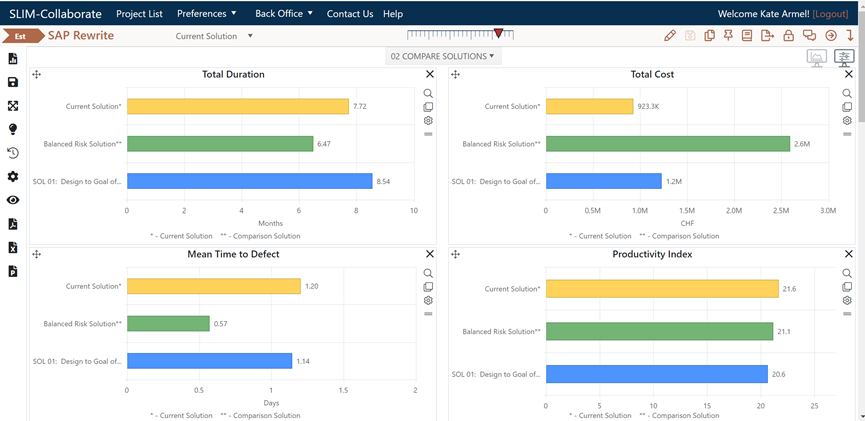
SLIM-Collaborate dashboards provide an assortment of charts and reports you can use “out of the box” or customize to better understand and visualize the data and projects in your portfolio. It may help to think of each dashboard as a page that can display up to sixteen charts or reports. Dashboard charts and reports can be viewed within SLIM-Collaborate or exported to PDF, Microsoft Excel, or PowerPoint formats.

Different dashboard types serve different purposes. Portfolio dashboards (example shown above) display multiple projects from your portfolio on the same chart or report. Because they draw from the list of projects currently displayed on the Project list, portfolio dashboards are accessed via a toolbar icon on the Project List page.

Project dashboards (example shown below) display and analyze data and solutions from a single Estimation or Closeout project. They are displayed when you open an Estimation or Closeout project.

The following help topics explore the differences between project and portfolio dashboards in more detail.