To open a Portfolio dashboard, log in to SLIM-Collaborate, filter the project list if desired to select the group of projects you wish to analyze, then click the Portfolio Dashboard icon located in the upper right toolbar of the Project List page, as shown in Figure 1.

Figure 1: Project List
If you previously designated a “Favorite” dashboard, your choice will be loaded automatically every time you access the portfolio dashboard. If you have no Favorite (or if you “unfavorite” your previous Favorite dashboard during a working session), the last used portfolio dashboard will be remembered and displayed. Note that it may take a few seconds for the dashboard to load. While the dashboard is loading you may see a spinning circle icon.

Dashboard load times will vary according to your internet connection, browser, and dashboard content. Dashboards that display a large number of projects or which require extensive calculations (generally, those containing trend, benchmark, quadrant, and five-star charts and reports) can take some time to load. Filtering the project list to reduce the number of projects displayed or placing more complex charts and reports alone on a view will help reduce load times. Please allow sufficient time for content to be retrieved from the server and displayed on the dashboard.
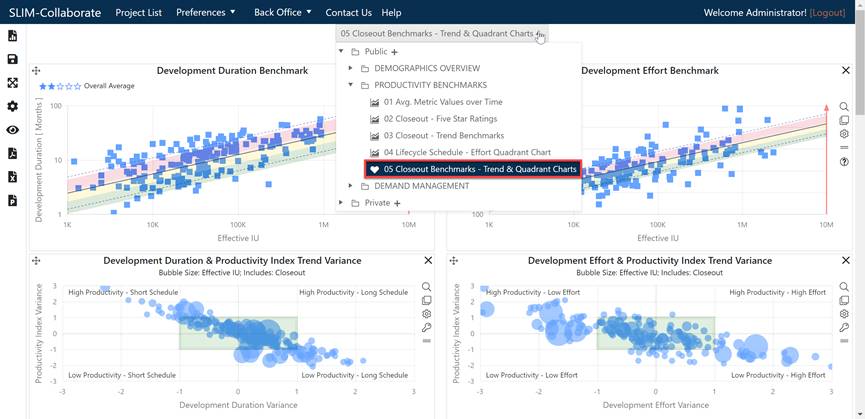
To load a different dashboard, select one from the dashboard selector control at the top of the dashboards window. If you have designated a Favorite dashboard, your selection will be remembered the next time you access the Portfolio dashboard. Otherwise, the last-used dashboard will be used.

For more detailed information about the charts and reports available on Portfolio dashboards, see the Portfolio Chart Types topic in this user guide.
Let’s take a moment to walk through the different parts of the dashboard.