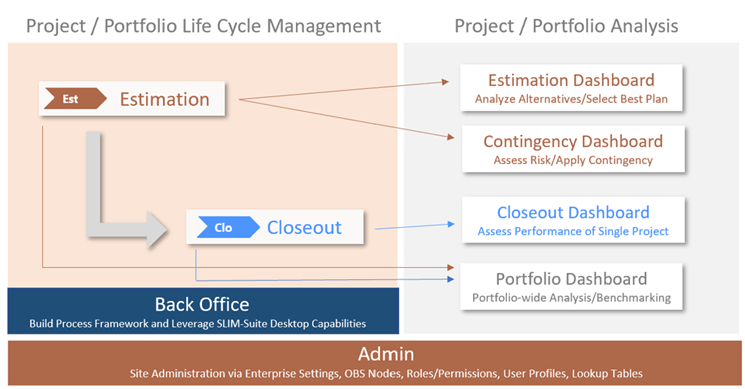
The selection of charts and reports available on various dashboards depends on the dashboard type (portfolio vs. project) and project stage (Estimation vs. Closeout). Portfolio dashboards are designed to display or compare data from multiple projects – and depending on chart settings, from projects in multiple stages - on any given chart or report. Project dashboards - with the exception of historical trend comparison solutions - display information for a single project. As you can see from the diagram below:
•Estimation stage projects can be displayed (alone) on Estimation and Contingency dashboards or compared with other projects on the Portfolio dashboard.
•Closeout stage projects can be displayed (alone) on Closeout dashboards
or compared with other projects on the Portfolio dashboard.
Estimation, Contingency, and Closeout dashboards are all project-level dashboards, but the list of available charts and reports differs according to the project’s current lifecycle stage and the analytical purpose of each dashboard. Thus, as projects advance through the lifecycle stages, the list of available dashboards (and thus, charts and reports) will change. This may be easier to understand by looking at a single project.
Let’s begin with a project in the Estimation stage. The project’s current solution, along with any logged, comparison, historical, or contingency solutions, can be displayed on Estimation project dashboards. Dashboards for projects in the estimation stage are designed to compare/contrast alternative plans, risk-buffered contingency solutions, and on trend charts only, historical comparison solutions. To compare the estimate to other projects in the SLIM-Collaborate portfolio (other estimates or completed/closeout projects), you could open a Portfolio dashboard configured to show projects in the Estimation and/or Closeout stage(s). In this case, only a single solution (the current one) is displayed for each estimation stage project.
The Estimation dashboard is designed to compare alternative solutions and select the best one as the basis for competitive bids or a working plan, against which progress can be measured and assessed. The Portfolio dashboard aggregates cost and schedule data from multiple estimates (projects in the Estimation stage) to provide a bird’s eye view of current and anticipated work, cost, and staffing.
Once our imaginary project completes, it will be advanced to the Closeout stage. The advanced “Estimation” solution time, effort, phase start/end dates, size, and defect information will be updated with final, actual performance data. With the final, or “closeout” performance data in place, the project can be benchmarked using the Closeout dashboard or compared with other completed projects on an appropriately configured Portfolio dashboard.
The table below shows available charts and reports for each
major dashboard type.
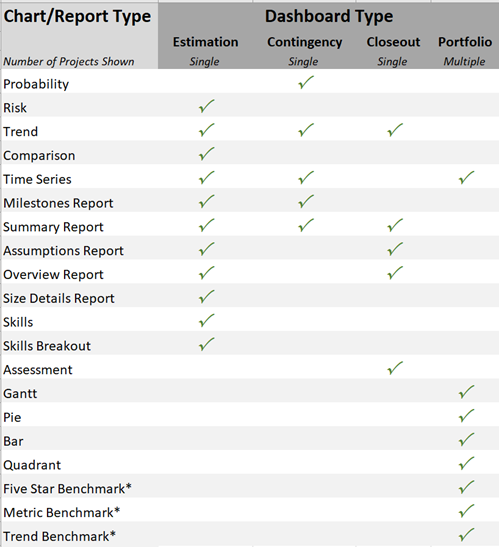
Chart Availability by Dashboard *Closeout projects only