Projects in the Closeout
stage have their own project dashboards that come with a series of predefined
Public dashboards you can use “as is” or customize to perform various analysis
tasks. The Closeout dashboard is very similar to Estimation project
dashboards in both form and function. The main difference is that Closeout
dashboards are designed to support post-closeout benchmarking, reporting, and
performance analysis against the project’s designated benchmark trend
group.
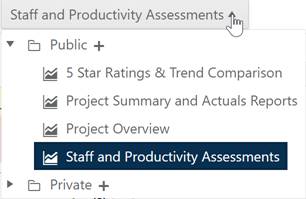
To see the list of predefined (or “out of the box”) Public Closeout dashboards, simply edit any Closeout project from the project list and expand the drop-down Dashboards selection list.

The 5 Star Ratings & Trend Comparison dashboard view replicates the same charts used on the View Closeout page in versions 3.1 and before (Duration, Effort, and Quality/MTTD trend charts, combined with a 5-star assessment for each metric).
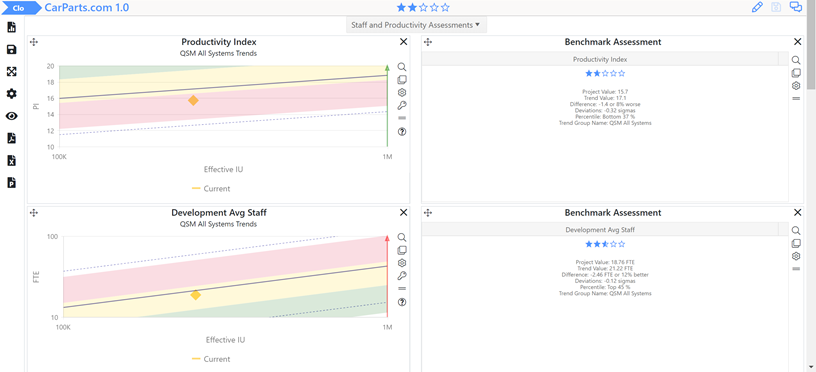
The Assumptions and Summary Reports and Project Overview dashboard views provide project reports (similar to those available to projects in the Estimation Stage) that can be exported to Excel. The Staff and Productivity Assessments view provides the same charts (trend and 5 star) as the 5 Star Ratings view but focuses on productivity and staffing metrics.