The project metric assessment chart provides a quick, high-level assessment of a single project performance metric against the project’s designated benchmark trend. A five-star assessment, percentile rank, and other summary statistics are provided.

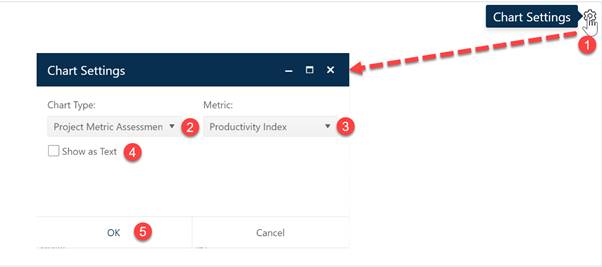
To create a project metric assessment chart of report, go to an existing chart or report (or a blank dashboard slot) and click the Chart Settings icon. On the Chart Settings dialog, select Project Metric Assessment from the Chart Type combo box. The fields available for configuring will update as you select different chart or report types.

Next, choose the Metric you wish to benchmark against the project’s trend group. Use the Show as Text checkbox to display your metric assessment chart in either chart or report form. When the chart settings are configured to your satisfaction, click OK to exit the Chart Settings dialog and display your new Metric Assessment chart.

If you change your mind about any of the original settings,
use the Chart Icons toolbar located at the right side of the
chart to change the metric displayed or change other chart options. If the chart
icons toolbar is not visible, you can show/hide it using the eyeball icon ( ) in the dashboard toolbar.