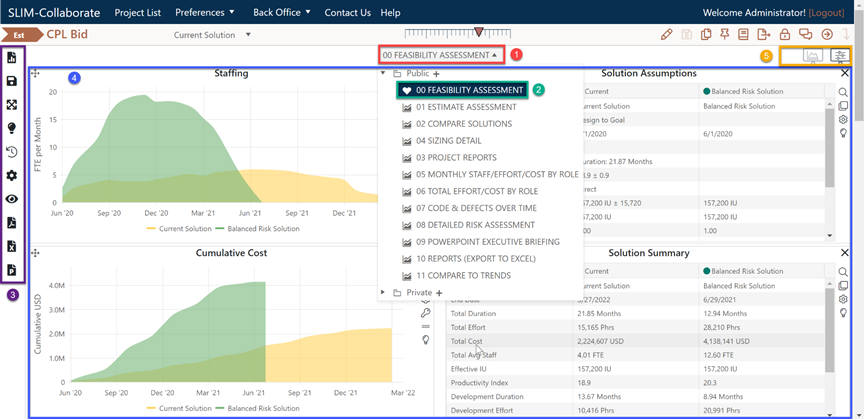
Whether you’re working with a Project or a Portfolio dashboard, the interface you’ll use to create, display, edit, and save dashboards is very similar. One exception to this general rule is the uncertainty sliders, which are only available on Contingency Dashboards. For detailed guidance about using uncertainty sliders, see the Understanding Target Probability Contingency and Probability Charts topics in this user guide.

Project and portfolio dashboard
pages contain the following elements:
1. Dashboard Selector. Above the charts and
reports at the center-top of the dashboard, the current dashboard title is
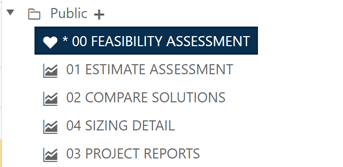
displayed in a drop-down combo box. An asterisk before the current dashboard
title means the dashboard has changed since it was last saved. Unsaved changes
are preserved only until you change dashboards or exit the current dashboard.
When switching between the Estimation and Contingency dashboards, you will be
prompted to save any unsaved changes.
Click the
down arrow to select a different dashboard from the list. As you rest your
cursor over each dashboard title, a hover tip displays the dashboard description
(if any). Also, icons for editing, deleting, and favoriting the dashboard also
appear. The selection of icons you see depends on the permissions in your
default user role. For example, while you will only see edit or delete
icons for Public dashboards if you have permission to edit/delete them, everyone
will see the Favorite icon.
Providing good descriptions for
each saved dashboard will help users ‘preview’ items in the list and easily
select the best dashboard for various analysis tasks.
2. Dashboard Name. The current dashboard title displays in the dashboard list (see item 1) and is highlighted in dark blue when the list is expanded. It is also included when charts and reports are printed or exported to Excel and PowerPoint. As asterisk will appear before the dashboard name if there are unsaved changes.

3. Dashboard Toolbar provides easy access to various dashboard features. Hover tips over each icon display each icon’s function. If no charts have been added to a dashboard, the Save Dashboard icon will be disabled.
4. Dashboard Window is where charts and reports are displayed.
5. Estimation/Contingency Toggle. For projects in the Estimation stage only, these large monitor icons toggle the dashboard window to display either the Estimation or Contingency dashboard.