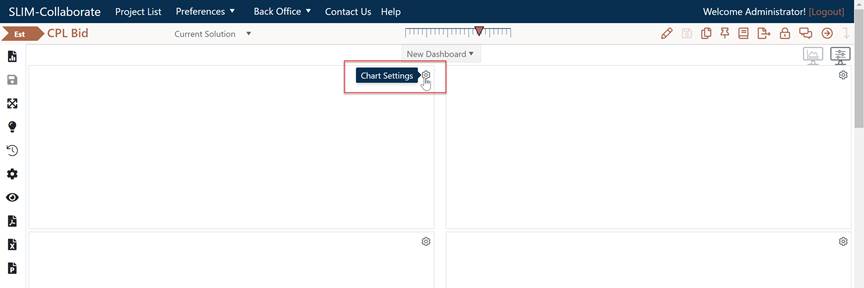
To create a new dashboard, use the New Dashboard icon in the dashboard toolbar. A new, blank dashboard with the default name “New dashboard” will be displayed.

The new dashboard interface
comes preloaded with 16 blank chart objects. To configure a new chart,
simply click the Chart Settings icon (gear) at the top right corner of
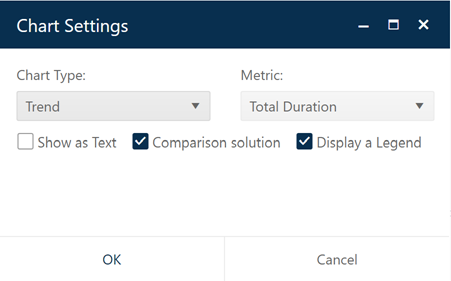
any chart object. The Chart Settings dialog appears.

Because different charts
and reports have different settings, the available configuration options will
update as you select various charts or reports from the Chart Type
drop-down list control. Use the controls in the dialog to configure your
chart or report, then click the OK button. Once created, charts can be easily
resized using the Column Layout control in the Dashboard
Toolbar.
The last step in creating a
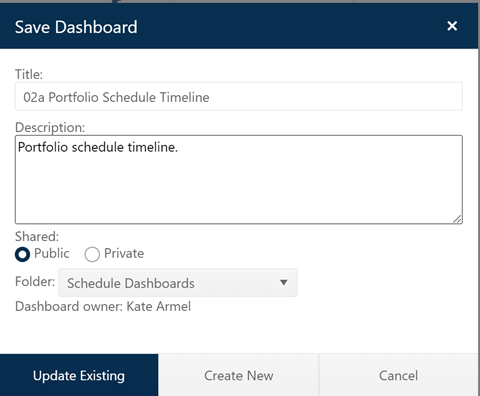
dashboard is to save it. Click the Save Dashboard icon. A save
dialog appears.

Type in a dashboard title and
description, then click the Create New button. If desired, you can create
a new folder or save your dashboard to an existing folder. Locked folders are
not available as destination folders, and dashboards within locked folders
cannot be replaced/saved over. See the Saving Dashboards topic for more detailed
guidance on the settings provided. Your new dashboard title will appear in the
Dashboard List in alphabetical order under the appropriate (Public or
Private) folder or subfolder. From here you can continue to edit your
dashboard as needed to add desired charts for printing and presentation. After
editing a saved dashboard, remember to save it again to preserve your
changes.