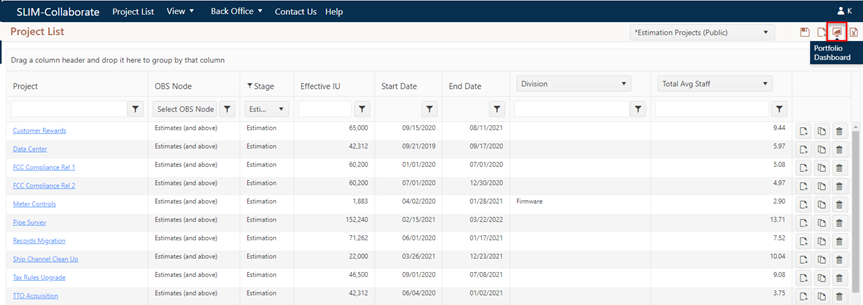
To view or benchmark multiple closeout projects from your portfolio, use the Portfolio Dashboard icon available from the main Project List page.

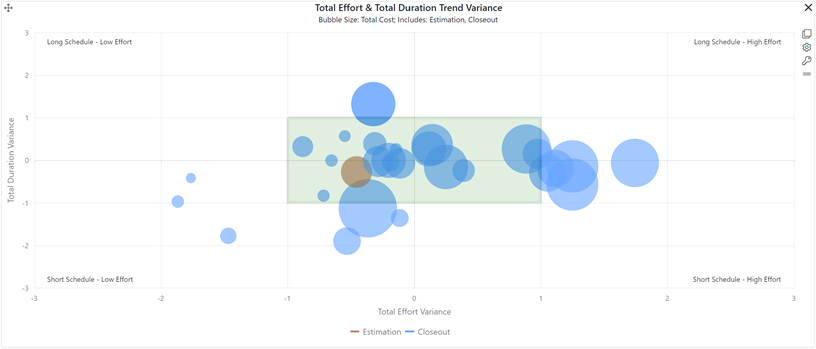
Portfolio Dashboards provide a graphical summary of the estimates and closeout projects in your project portfolio. The analysis process begins on the Project List view, where projects in your portfolio are sorted, grouped, and filtered into relevant subsets. For benchmarking purposes, it’s important to compare projects that share similar characteristics such as complexity, application type or domain, or other characteristics of interest to your organization.
Once you have selected a group of projects for analysis, you can display and analyze them using the Portfolio Dashboard. If your goal is to benchmark completed (closeout) projects, you’ll want to filter the project list view to contain only projects in the closeout stage before loading the Portfolio Dashboard.
For detailed information on using the Portfolio Dashboard for completed project benchmarking, see the following topics:
•Project Analysis Using Portfolio Dashboard
•Deciding Which Projects to Display
You may also wish to check out the “out of the box” portfolio dashboards that ship with SLIM-Collaborate and use the ones specifically designed for benchmarking closeout projects.
