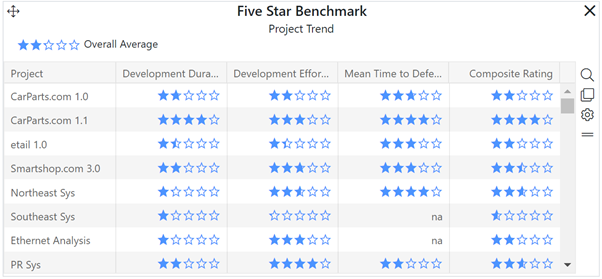
The five-star benchmark chart allows you to benchmark completed project performance against QSM industry or custom benchmark trends created using your own projects. High-level, “at-a-glance” benchmark information is provided via “five-star ratings”. For each project in your current filter, a five-star rating is calculated for project duration, effort, and MTTD (relative to the trend). A composite rating (based on these three key metrics) is also displayed for each project and an overall composite rating for the entire group of projects is shown in the sub header area. For more information on how these ratings are computed, see the Five Star Metric Ratings later in this user guide. Note that five-star benchmark charts only include completed Closeout projects.

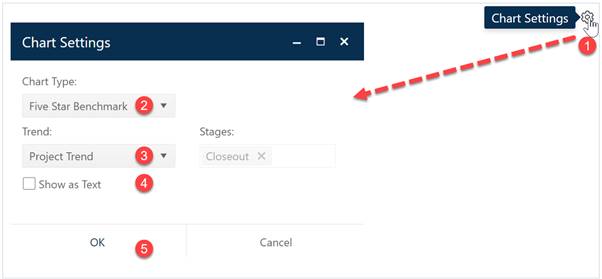
To create a Five Star Benchmark chart, go to an existing chart or report (or a blank dashboard slot) and click the Chart Settings icon. On the Chart Settings dialog, select Five Star Benchmark from the Chart Type combo box. The fields available for configuring will update as you select different chart types.

Next choose the Trend used for calculating the five-star ratings. You can select a specific trend provided by your Back Office administrator, the trend associated with each project (Project Trend) or use the Most Common Trend option (the trend used by most projects in your current filter). The selected trend option will appear on the chart subtitle. Next, decide whether you wish to display the chart or report form (Show as Text). When the chart settings are configured to your satisfaction, click OK to exit the Chart Settings dialog and display your new five-star benchmark chart.
If you change your mind about any of the original settings,
use the Chart Icons toolbar located at the right side of the chart to
change the Trend used. If the chart icons toolbar is not visible, you can
show/hide it using the eyeball icon ( ) in the dashboard toolbar.

The chart version of the Five Star Benchmark displays the rating as colored stars, while the text form shows the rating as a numeric value from 0 to 5. Only the text version can be exported to Excel.
NOTE: due to the number of calculations needed to produce individual ratings for each project, five-star charts and reports can take a long time to render (especially if more than one is placed on a view). Should you encounter performance issues with these charts, try limiting the number of projects displayed by filtering the project list prior to using views with five-star charts or reports.