To access the Contingency Dashboard, you must create a new Estimation project or edit an existing one. On the main project page of the project you’re working with, the Contingency Dashboard link is located just to the left of the Current Solution Assumptions section.

To access and use the Contingency dashboard, the Current
Solution for the project you’re working with must be valid AND unlocked.
•If the current solution is not valid, the Contingency Dashboard
button will not be displayed. Instead, you will see a pink banner that
says, “The Current Solution is incomplete” and the dashboard will be blank.

•If the project is locked (generally, because it is currently
checked out for Round Trip data exchange with SLIM-Estimate) the Contingency
Dashboard button is visible and enabled, but you will not be able to use the
uncertainty sliders to update and save the project. The Update
Solution button will be disabled, and a red icon will appear if you hover
over the Update Solution button.
For more information on valid solutions and locking/unlocking
projects during Round Trip data exchange with SLIM-Estimate, see the following
topics:
When you open the Contingency Dashboard, the Current
Solution is displayed on charts and reports in yellow. There are two
categories of chart types available for selection:
1.
Probability Charts show the range of probabilities for the major metrics
associated with your current solution. Depending on the metric chosen,
these charts may show the range of input values (e.g., size and PI) or the range
of outputs from the Monte Carlo simulation (e.g., duration, effort, cost, and
MTTD). Notice that your current solution will always show the expected
value at the 50% mark.
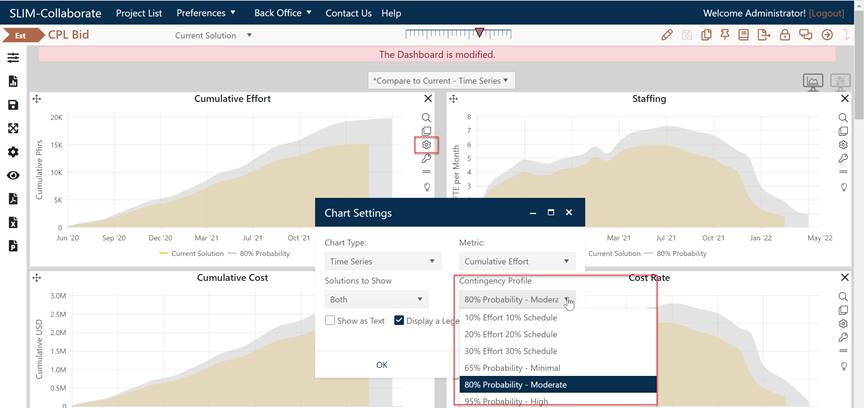
2. All other contingency charts can be configured to show the Current Solution and/or a single Contingency Solution, allowing you to apply and compare various Contingency profiles and compare these risk-buffered solutions with your Current Solution.
The selected contingency profile, displayed in grey shading, can be viewed or changed using the Contingency Profile drop-down on the chart settings dialog.

SLIM-Collaborate supplies a range of preconfigured contingency profiles and public dashboard views to get you started. Over time, you will probably want to customize these views and save Private copies of them (private dashboard views are visible only to their creator). Once you have done this, your customizations will be available for use any time you view the Contingency Dashboard. Both public and private dashboard views (pages with charts and reports) are shared by multiple projects, but the uncertainty slider settings will always reflect the current solution of the project you are working with (if you have used the dashboard previously and saved the project).
For detailed guidance on using the dashboard, charts and reports, and contingency profiles, see the Contingency Dashboard Charts and Reports section of the Project and Portfolio Dashboards section of this user guide.