The Estimation dashboard can hold an unlimited number of dashboards, each containing up to 16 charts or reports in a fully customizable arrangement. Several pre-defined public dashboards come with Collaborate, but you can also create and display an unlimited number of dashboards that can be kept private (only available to their creator) or – if you have sufficient permissions – publicly shared across the enterprise. Dashboards can be organized using public and private folders and subfolders and each user can set a favorite dashboard. You can export dashboards to MS PowerPoint and PDF formats, and text reports to MS Excel (see Exporting Dashboards to PowerPoint, Export Dashboards to PDF and/or Exporting Dashboards to Excel for more information).
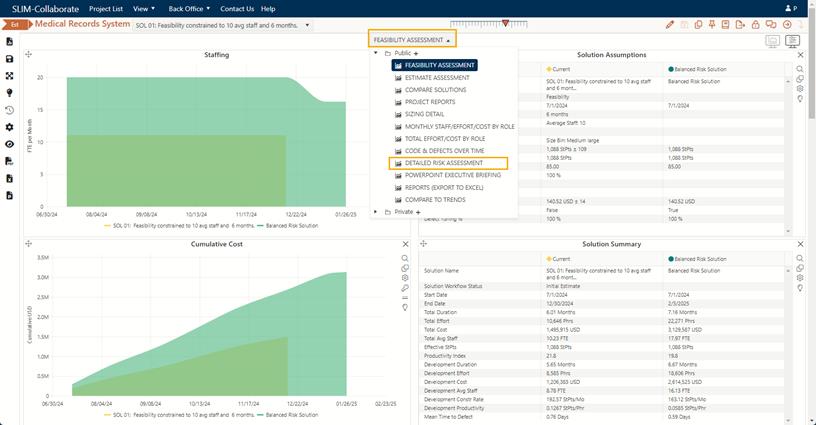
Expand the Dashboard Selector control and select DETAILED RISK ASSESSMENT.
The pointers on the risk chart vary from very conservative (blue) on the left, to typical (gray) in the middle, and risky (red) on the far right, based on how much each metric deviates from the average trend line. Hover over the composite risk rating to view more information. The Balanced Risk Solution represents the average performance from the project’s estimation trend, so all metrics are labeled “typical.”
For the Current Solution, the key factors for most projects, Total Effort, Total Avg Staff, Total Duration, and Productivity Index, are Moderately Risky.

The nonlinear tradeoff relationship between time and effort (backed by over 45 years of experience and over 14,500 projects in QSM’s industry database) shows that the effort Rintell must expend to achieve a 1.2-month reduction in Total Duration is very high and likely cost prohibitive. Even this seemingly small amount of schedule reduction requires productivity that is higher than the industry average for a project of this size. QSM’s productivity metric – the PI, or productivity index (PI) - accounts for the efficiency of the entire development environment including tools and methods, technical complexity, personnel, and other factors. It is calculated from completed projects: either your own, or those in the QSM industry database. The Feasibility solution method calculates the Productivity Index required to meet the desired duration and cost/effort/staff goals. Successfully implementing the proposal team’s estimate would require a PI of 21.8 ― 19.8 is typical for the industry for a project of this size.
Phillip wants to look at the industry trend charts to understand the tradeoff dynamics. Select dashboard ESTIMATE ASSESSMENT.
Notice the two trend charts for Total Duration and
Productivity Index. Click on the question mark  icon in the chart controls menu to
display a popup help guide to interpreting trend charts. You can learn
more reading Trend Charts in the
online help. Trend charts allow you to compare your estimates to industry
and custom trends as well as completed projects. Click on the
Historical Solutions Selector
icon in the chart controls menu to
display a popup help guide to interpreting trend charts. You can learn
more reading Trend Charts in the
online help. Trend charts allow you to compare your estimates to industry
and custom trends as well as completed projects. Click on the
Historical Solutions Selector  icon in the dashboard control menu to
select a saved public filter containing completed (Closeout) projects to display
on trend charts. Select the Medical Records History filter that Phillip
created.
icon in the dashboard control menu to
select a saved public filter containing completed (Closeout) projects to display
on trend charts. Select the Medical Records History filter that Phillip
created.

The historical solutions are displayed as gray circles. Hover your mouse over a data point to see the Solution Name and data for a particular trend metric. The selected historical solutions will be saved when you save the project. To remove them, click on the dashboard control and select None for the Selected Project Filter.

Although there are only five Medical Records historical solutions, Phillip can immediately see that the Total Duration of 6 months suggested by the proposal team is much shorter than the durations from Rintell’s previous projects. Likewise, the PI required to achieve the proposal goals is much higher than their recently completed projects. Phillip wants to explore some alternative solutions that are more in line with Rintell’s demonstrated capabilities.