The Estimation Dashboard is a collection of views, each of which can hold up to 16 charts and reports. You can select one of the preconfigured views using the pull-down Dashboard Selector control at the top of the page or create your own private or public dashboard. See the Project and Portfolio Dashboards section for more information on creating and working with dashboards.
The FEASIBILITY ASSESSMENT dashboard helps Phillip zero in on key metrics to help him evaluate the reasonableness of the proposal:
•Staffing and Cumulative cost charts
•Solution Summary and Solution Assumptions reports
Once you have created an estimate that reflects your project goals (the solution you’re working with at the moment is called the Current Solution), SLIM-Collaborate compares it to a recommended estimate based on typical performance data from projects of the same size and type. This estimate is known as the Balanced Risk Solution and reflects average schedule and effort data from the project’s Trend Group (in this case, the QSM Business AGILE trends). Once Rintell Corporation collects enough completed projects to create and use their own trend lines, the Balanced Risk Solution will always reflect the average capabilities of their organization for projects of the same size.
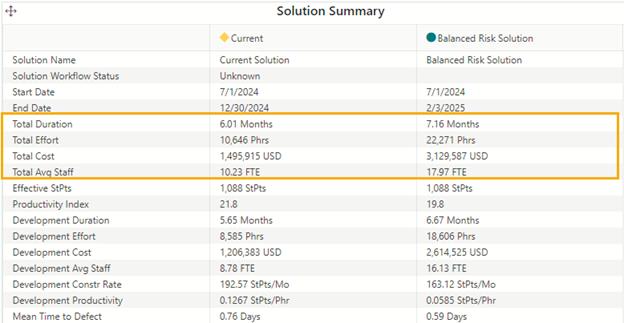
The Solution Summary report provides a detailed comparison of the core metrics for both solutions.

Compare the Total Duration, Effort, Staffing, and Cost for the current and balanced risk solutions. Note that the Balanced Risk solution uses more effort and takes one month longer to deliver the same amount of functionality (1,088 StPts). This solution assumes average industry schedule and effort performance. The Current solution (based on the Sales team’s proposed schedule and staffing, rather than typical industry capability) takes less time and uses less effort. Assuming better than average schedule and staffing performance is a possible risk factor for this estimate.
The risk gauge at the top center of the page indicates that this project has an overall risk rating of Moderately Risky (hover over the triangle, which positions just past the center of the gauge, to see a helpful hover tip), meaning that the desired schedule and effort or team size are slightly riskier than the recommended estimate. Clicking on the Risk Gauge brings up a window with more detailed descriptions of the various risk ratings.

The Staffing chart helps Phillip and other stakeholders visualize resource requirements as the project gets underway.
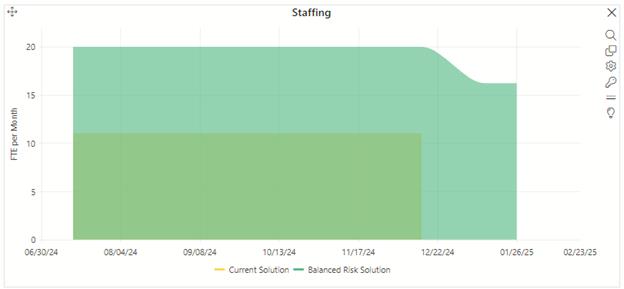
Notice that although the Avg Staff desired for the project is 10 full-time equivalent (FTE) people for the Current solution (desired outcome, based on sales targets), the Balanced Risk (recommended estimate) solution shows that a project of this size typically requires a team twice as big!
The proposed 6-month duration is shorter than the Balanced Risk Solution of 7.16 months. The proposal team determined the required team size based on the size of their Agile teams, along with their desire to keep costs down and increase the chances of winning the contract. What Phillip doesn’t know is whether Rintell is capable of meeting both the effort and duration targets. How many resources would it take if he relaxed the schedule? To explore some alternative solutions, let’s look at the Risk chart to see which software production core metrics contribute the most towards the Moderately Risky overall risk rating.
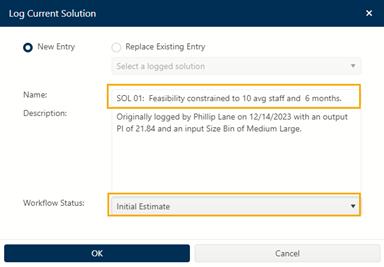
To preserve the current solution, click the Log Current
Solution (pushpin) icon  in the top horizontal tool
bar. One powerful benefit of SLIM-Collaborate is the ability to quickly
and easily explore a range of potential project outcomes and assess their
relative risks. The Solution Log makes it easy to store, reload, and
compare solutions. Collaborate will provide a default solution name based on the
sequential solution IDs, along with the solution method and major assumptions.
Phillip is satisfied with this information.
Rintell Corporation’s Site Administrator has configured SLIM-Collaborate’s Solution Workflow Status tags to align with the steps in their project management process. Once workflow status tags are configured by your site administrator, they are viewable on the Solution Summary Report and Solution Log dialog. Because they are solution-specific, workflow statuses are set via the Solution Log dialog. Since this is a brand-new project, the Workflow Status for Phillip’s initial solution is set to the default status (“Unknown”). Select the Workflow Status drop-down to display the tags used to mark Rintell’s lifecycle status options, from Initial Estimate to Enter Actuals. Change the status to Initial Estimate to tell other stakeholders that this project is ready for review, then click OK to log the Feasibility solution. The Solution Name is updated on charts and reports.
Next, click the Project Notes icon  on the project toolbar. Here,
Phillip can create a note stamped with his name and the current date and
time. His note will be accessible to all stakeholders who have access to
this project. SLIM-Collaborate users can subscribe to Email Notifications
whenever notes are added to a project they have access to.
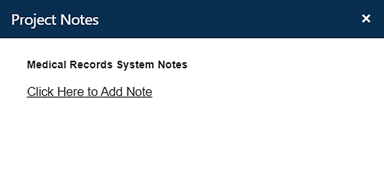
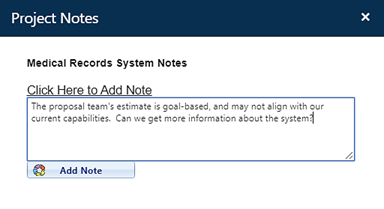
Click on the link to add the note shown below. Click the Add Note icon when you are finished typing the note – “The proposal team’s estimate is goal-based and may not align with our current capabilities. Can we get more information about the system?“
Close the note dialog and click the Save Project
icon  in the project toolbar to update the
Feasibility estimate. Click Project List in the Site menu
bar (upper left-hand corner of the project page) to return to the Project List
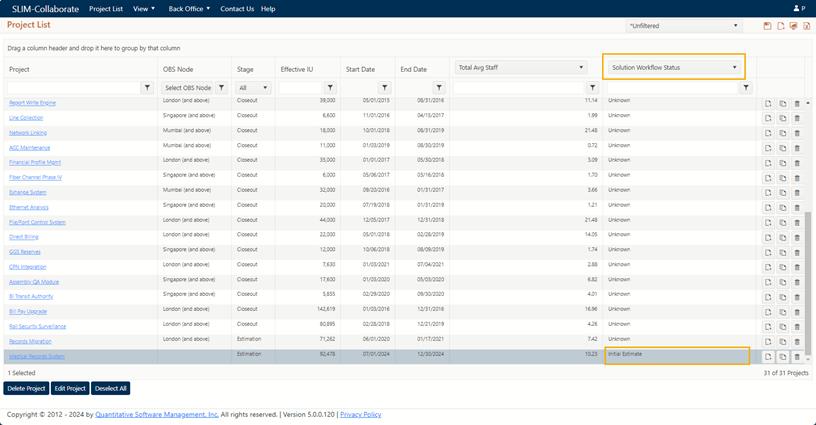
page. Click on the pull-down menu for one of the two custom metric
columns on the right and choose Solution Workflow Status. The
Medical Records System project is tagged as an Initial Estimate. Take a
moment to review the list of metrics available for either column.
Click on the Medical Records System link in the
first column (Project) to open the project page.