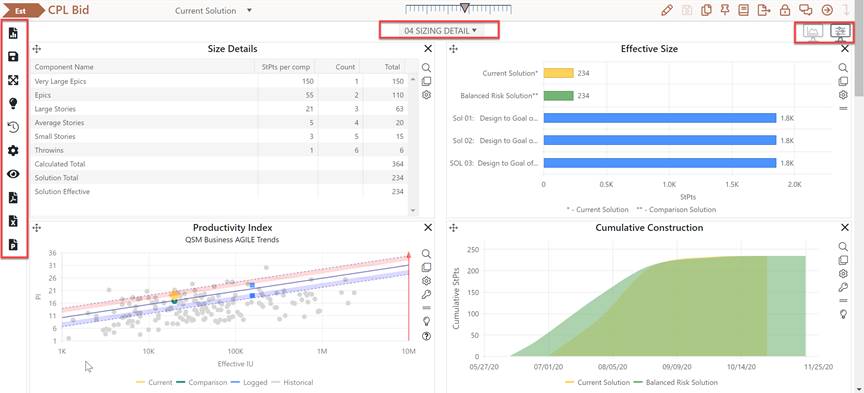
The Estimation dashboard is accessible directly from the project page and occupies most of the page’s real estate. You can use the blue dashboard toolbar icons on the left-hand side of the page and the dashboard selector (center topic of the dashboard area) to display up to sixteen charts or reports on a single page and export a dashboard to PDF, Excel, or PowerPoint.

Unlike the Portfolio dashboard, project dashboards are designed for analyzing a single project and are available only when editing a project in the Estimation or Closeout stage. They can be public (available to any user with View permissions to the project) or private (visible only to the user who created them), and they are specific to the project’s current lifecycle stage. Hence, a project advanced from the Estimation stage to Closeout will no longer be able to use Estimation or Contingency (estimation stage) dashboards. Instead, users will see Closeout dashboards specifically designed for post-project analysis and benchmarking.
You can toggle between these two dashboard types using the monitor icons in the top left-hand size of the dashboard area. For more detailed descriptions and instructions on using project dashboards, see the Project and Portfolio Dashboards and Dashboard User Interface sections of this user guide.