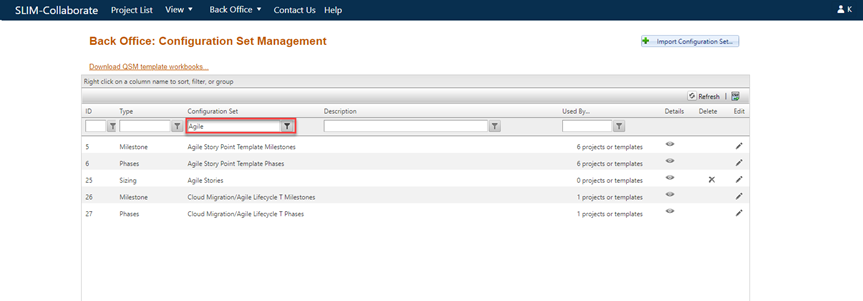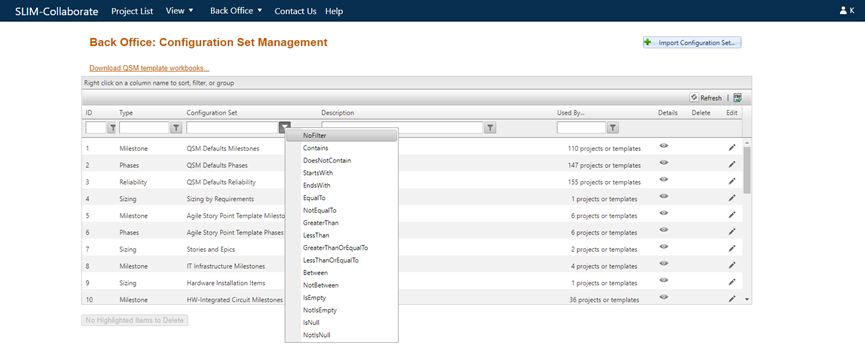
The user interface and logic for filtering grids on the Project List, Filter Management, and Dashboard Management pages is very similar, but the Project List has a few options that are not available on the other two grids. Since the Project List page is the most complex, this help topic focuses on project list filtering and notes where the Filter and Dashboard Management pages differ.
Before you begin creating your first filter, it is helpful
to think about the project characteristics (metrics) and filter conditions you
will use to select the group of projects you need. It also helps to decide on
column, grouping, and sorting options to organize your results on the finished
project list. Luckily, you can build and save your filter incrementally.
In SLIM-Collaborate 5.0, the following attributes can be used in or saved to a
filter. 
•Grouped Columns
•Filtered Columns (filter values and conditions applied to a given column)
•Sorted Columns
•Hidden columns (right-click option from column heading)
•Metrics displayed in the custom columns
This is easier to understand with an example. To display only projects in the Closeout stage, select “Closeout” from the Stage column drop-down control (no filter icon is available as there are only three choices (All, Estimation, and Closeout). If you filter on multiple columns, your filters will be combined using an ‘and’ operator. (Example: Stage = Closeout AND Start Date On or After 12/31/2018 AND End Date On or Before 12/31/2021 would display only Closeout projects that completed during the specified date range).

Once you save a filter, you can view these attributes on the Filter Management page’s Details column.