Trend Group
Trend groups are simply logical groupings of generated
metric trend lines, calculated from a group of related projects that share one
or more important characteristics. SLIM-Collaborate ships with 18 sets of
trend group data from the QSM database, but your Back Office administrator can
also create and upload custom trends in SLIM-Suite desktop tools using your own
completed project data.
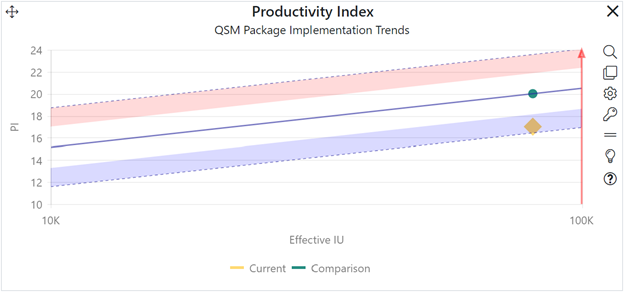
QSM trends capture the relationship between major project
management metrics like schedule, effort or cost, average FTE staff, defects,
and Productivity at various project sizes. The trend lines themselves show the
average and +/- one, two, and three standard deviation metric values, regressed
against normalized project size. In the chart below, lifecycle duration
(schedule, in months) is on the vertical axis, and new and modified (effective)
size is on the horizontal axis.

As you can see, average schedule
values increase with size. This makes sense, because there is a direct
relationship between the amount of functionality built, tested, and delivered
(size) and the time it takes to complete that work (duration). Of course, other
factors also influence schedule performance, but the relationships between
application size and the major management metrics (duration, effort/cost,
staffing, defects, and productivity) are robust and consistent over time and
across application domains. Your SLIM-Collaborate license includes downloadable
QSM industry trend lines, but organizations with a SLIM-Metrics desktop license
can create and upload their own custom trend lines via the Back Office
Service to facilitate internal benchmarking, estimate calibration, and risk
management.
In the Estimation Service, the primary trend group is used
to generate Trend Based and Balanced Risk solutions and validate current or
comparison solutions against relevant projects from the QSM database (or your
organization, if you have uploaded internal reference trends created in
SLIM-Metrics). Trend groups are also used to generate risk assessments and
select an appropriate Productivity Index (PI) value for solution methods where
productivity is a solution input. In the Closeout service, trend groups are used
to benchmark completed projects and calculate five-star performance assessments.
