SLIM-Collaborate goes beyond promoting collaboration on project lifecycle management activities to provide business intelligence for an entire portfolio of projects. User roles, permissions, OBS assignments, and project access settings can be configured to allow stakeholders to view only groups of projects they are involved in or share project data across the entire enterprise.
Ian Stark, Phillip’s Portfolio Manager, has seen the Medical Records System closeout data, and now would like to see how that project performed against others in his division. On SLIM-Collaborate’s login screen (see Logging In for details on how to access the SLIM-Collaborate sandbox site for your organization), enter the following credentials:
Username: ian.stark@rintellcorp.com
Password: #estim8!
Ian manages Division 1, which has offices in London, Mumbai, Brisbane, and Singapore. The 31 projects in his portfolio are a mix of Estimation and Closeout projects. Most of them are completed and have been advanced to the Closeout stage.
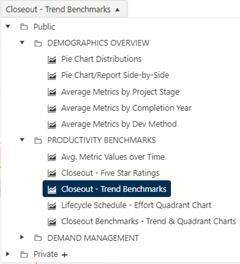
Collaborate’s Benchmark charts are part of the Portfolio Dashboard. This dashboard provides three benchmark charts for analyzing Closeout projects only: Trend, Metric, and Five Star. Click the Portfolio Dashboard icon in the upper right of the Project List page, then choose the public dashboard Closeout – Trend Benchmarks, located in the PRODUCTIVITY BENCHMARKS folder.

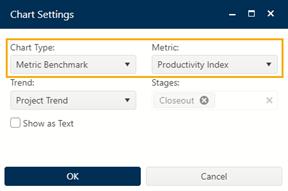
If they are not already visible, use the hide/unhide
dashboard controls icon  to access the chart controls and change
the Development Effort Benchmark chart in the upper right corner to a
Metric Benchmark using the chart type selection pull-down. Select
Productivity Index from the Choose Metric drop-down selection
list.
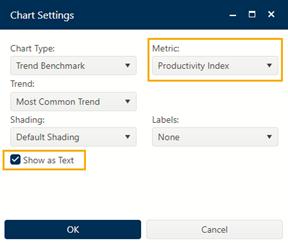
Next, change the Mean Time to Defect Trend Benchmark chart metric to Productivity Index and check to option to Show as Text.
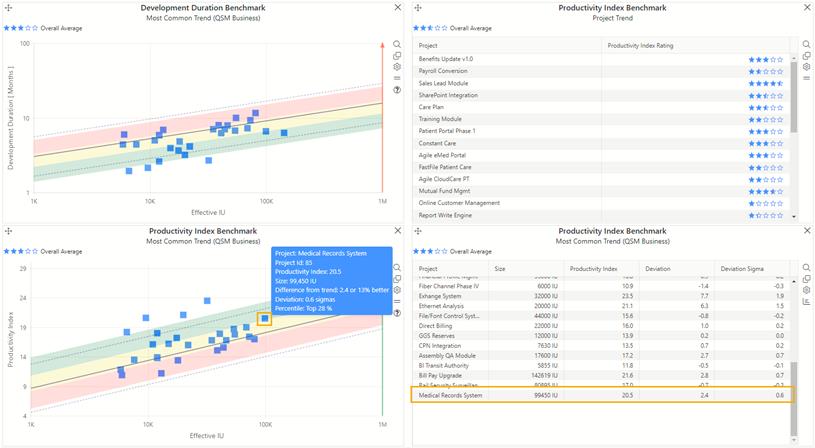
The trend benchmark charts display groups of related projects against a benchmark trend. Here, Ian can view multiple projects against the trend group of his choice, by selecting a specific trend group name, the Most Common trend among the projects in the filter, or the Project trend associated with each project. These projects are assessed against the QSM Business trends, as shown on the trend chart title, since it is the most common trend among this group of projects.
Hover your mouse over the data points on the trend benchmark chart to see individual project details, or you can display the report beside the chart as Ian has done.
The Medical Records System release positions well above the average Productivity vs. Size trend. The projects in Ian’s portfolio exhibit a wide range of PIs − about two-thirds higher than average.
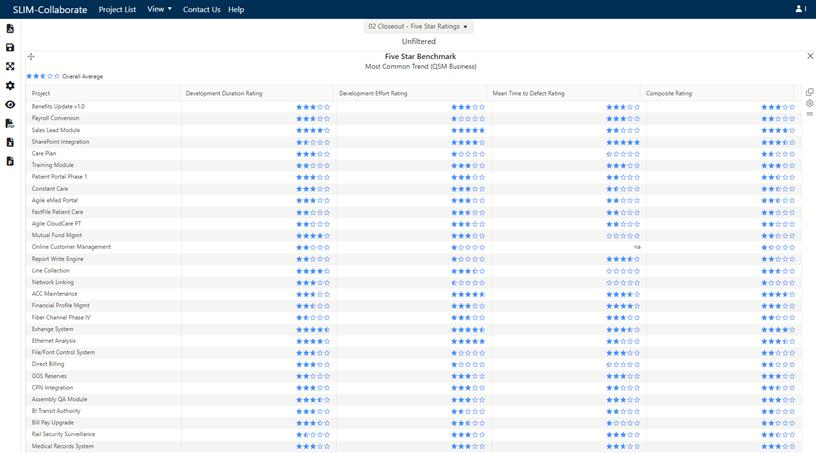
Metric benchmark charts show Five Star ratings for each project using the trend group specified in each project’s Project Settings. Select public dashboard Closeout – Five Star Ratings. Two types of ratings are calculated: a composite (overall) rating for the entire project and individual metric ratings for schedule, effort, and reliability. Projects are assigned a 0-5 star rating based on average values for the metric shown in the benchmark trend group. The trend group can also be changed on charts or reports on this view, using the Choose Trend chart setting.
