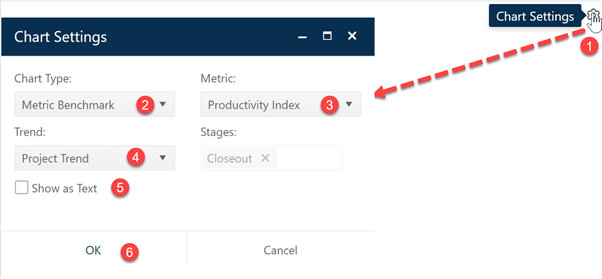
The metric benchmark chart is an extension of the five-star benchmark chart that allows you to select a specific benchmarking metric and assess performance against a benchmark trend group. A five-star rating is calculated for the metric you specify as well as an overall (composite) five-star rating for all projects being evaluated.
To create a Metric Benchmark chart, go to an existing chart or report (or a blank dashboard slot) and click the Chart Settings icon. On the Chart Settings dialog, select Metric Benchmark from the Chart Type combo box. The fields available for configuring will update as you select different chart types.

The metric you choose from the Metric combo will be used to calculate a five-star metric rating for individual projects from your portfolio. Available metrics are:
•PI
•Phase 3 metrics (Effort, Staff, Duration, Avg. Construction Rate, or Productivity)
•MTTD
•Defects SIT-DEL
Next, select the Trend to use for calculating the five-star rating – you can select each project’s associated trend group (Project Trend), the trend used by the most projects in your filtered project list (Most Common Trend), or a specific trend provided by your Back Office Administrator. The selected trend option will appear on the chart subtitle. Finally, check or uncheck the Show as Text checkbox to display the report or chart form of the Metric Benchmark chart. When your selections are finalized, click OK.
NOTE: due to the number of calculations needed to
produce individual ratings for each project, five-star metric charts and reports
can take a long time to render (especially if more than one is placed on a
view). Should you encounter performance issues with these charts, try limiting
the number of projects displayed by filtering the project list prior to using
views with five-star charts or reports.