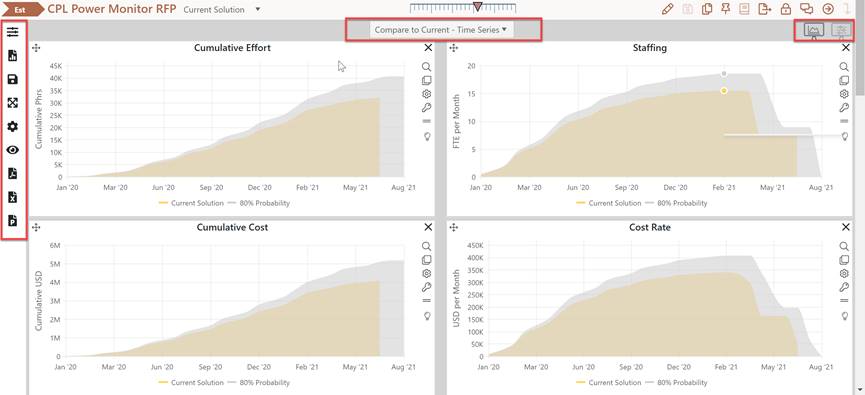
The Contingency Dashboard is a special purpose set of analysis dashboards available for use with projects in the Estimation stage. Once an estimator has generated and logged one or more solutions and identified the best work plan, the Contingency Dashboard makes it easy to apply one or more reusable contingency profiles to the current project solution and determine how much management reserve is needed to protect the enterprise from various risk factors that can cause the final schedule, effort, and labor cost to exceed their estimated values.

To display this dashboard, click the Contingency Dashboard (monitor) icon from the main project page. A list of public and private dashboards, each of which can be modified or exported to PDF, Excel, and PowerPoint, will appear at the center top of the Contingency Dashboard page. Use the blue dashboard icons down the left-hand side of the page to edit, save, resize, and export dashboards. The charts and reports displayed are preconfigured to display one or more risk-buffered “contingency solutions” alongside the current project solution.
Because contingency solutions exist only on the Contingency dashboard (they cannot be logged or edited directly) the background of the Contingency dashboard is grey to help distinguish it from the main Estimation dashboard. You can use the Contingency profiles and dashboard to develop risk-buffered bids, calculate and display one or more “worst case” scenarios based on project uncertainty and desired risk protection, set realistic expectations, and negotiate work plans and commitments that are achievable in light of past performance and constantly changing market conditions and client needs.
For detailed information on how it all works, see the Risk Buffering Estimates and Contingency Dashboard Charts and Reports sections of this user guide.