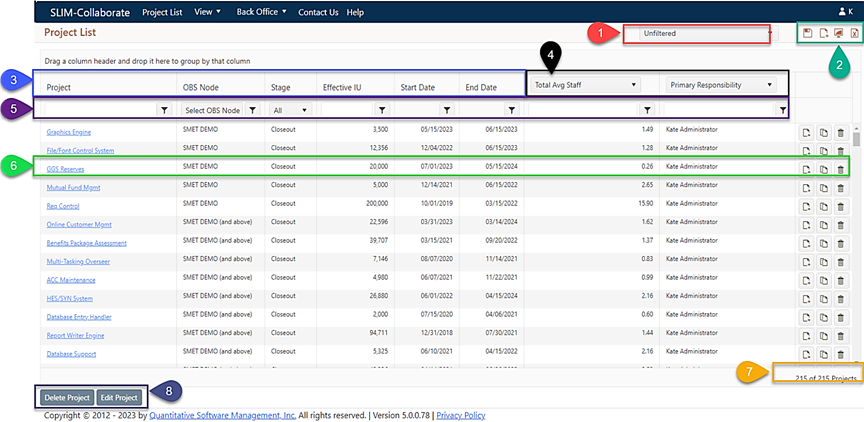

1. Power Editing Toolbar. Visible only when one or more projects in the grid are selected (see tooltip in item #8), this toolbar lets you edit, delete, archive/unarchive, or deselect the currently selected projects.
2. Choose Filter Selector. Drop-down list selector control used to clear the current filter, select saved filters, edit filter names, delete filters, and designate a favorite filter.
3. Toolbar. Contains icons used to save the current filter, create a new project from a template, display the portfolio dashboard, and export the current project list to Excel.
4. Fixed Columns. These column headings have fixed metrics. Columns can be hidden, but the metric displayed cannot be changed.
5. Custom Columns. These column metrics can be changed by clicking the drop-down selector control and selecting a metric from the list.
6. Filtering Fields. This row in the project list grid contains fields and controls for entering metric values (example, “12”) and choosing a filter operator (example, “greater than or equal to”). Clicking the folder icon in the Project column brings up a menu that lets you show or hide archived projects regardless of whether you are currently working with a filter or with an unfiltered portfolio.
7. Project Row. All cells in this row relate to the project named in the first cell. Click the Project link to open the project for editing. Column cells display the column metric values for the project and icons at the end of the row are used to clone the project, delete it, or create a new project with the same settings as the existing one.
8. Status Bar. This row displays text that shows how many projects are currently selected (if any), as well as the number of projects currently displayed in the grid and the total number in your portfolio (to which you have access).
Options for opening/viewing
individual projects or bulk/power editing multiple projects are covered in
detail in the following topics.