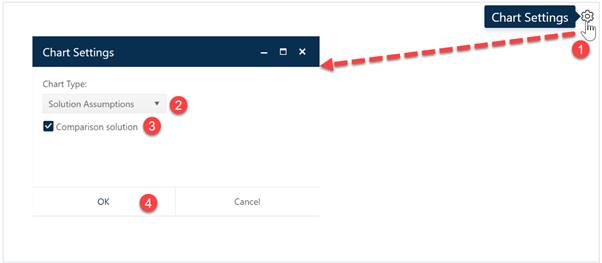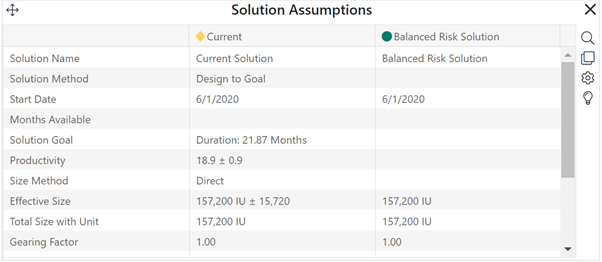
This report provides insight into the assumptions and constraints that were used to create the solution. Because solution inputs differ by solution method, metrics displayed on this report will reflect the method used to generate each solution displayed. To create a solution assumptions report, go to an existing chart or report (or a blank dashboard slot) and click the Chart Settings icon. On the Chart Settings dialog, select Solution Assumptions from the Chart Type combo box. The fields available for configuring will update as you select different chart or report types.

The Comparison solution checkbox toggles display of the comparison solution on or off. When the chart settings are configured to your satisfaction, click OK to exit the Chart Settings dialog and display your new Solution Assumptions report.
