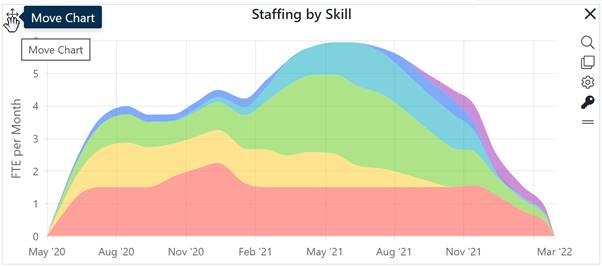
Charts and reports can be dragged and dropped into empty or occupied slots on the dashboard by positioning your cursor over the double-sided, crossed arrow icon located in the top of each chart or report and dragging the chart to the desired location in the dashboard grid.

As a dragged chart or report nears the empty slot, the title of the chart in the destination slot will change to match that of the chart you’re dragging. You can then drop the chart or report into place. This may cause other charts and reports on the dashboard to shift by one slot to fill the empty space from which the dragged chart or report was moved.
