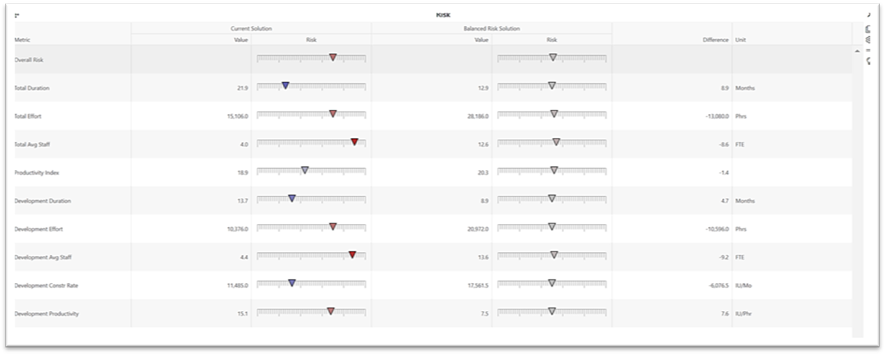
Once a valid solution has been calculated, an overall risk rating is displayed in the center of the project toolbar at the top of the project page. The risk bar consists of a grey bar and a small inverted triangle that gradually changes from dark blue (indicating a low or conservative risk rating) to grey (average risk), to red (high risk) depending on how closely the current solution’s schedule and effort match average duration and effort for a similarly-sized project from the project’s chosen benchmark trend group.
Click the overall risk rating meter to see a detailed summary.

Risk ratings range from conservative to risky:
•Conservative (blue triangle) solutions have much higher than average schedule or effort, compared to the selected trend group.
•Moderately Conservative (light blue triangle) solutions have higher than average schedule or effort, compared to the selected trend group.
•Typical (gray triangle) have average/close to average schedule and effort values, relative to your chosen trend group. NOTE: the Balanced Risk solution always has a “Typical” risk rating because it reflects average schedule and effort values from your selected trend group.
•Moderately Risky (pink triangle) solutions have lower than average schedule or effort, compared to the selected trend group.
•Risky (red triangle) solutions have much lower than
average schedule or effort, compared to the selected trend
group.