 on the project toolbar.
One of the SLIM-Collaborate features Phillip was interested in evaluating was capturing Rintell’s completed project data to benchmark performance and support future estimates and process improvement efforts.
Seven months later, the Medical Records System project has
completed. It was a great success! The team delivered the release in 7
months. The final size was very much on target, in part due to the Product
Owner’s understanding of must-have features. Now that the project has
completed, Phillip wants to enter the actuals and compute the actual PI
(productivity index) for the project. To do this, he will advance the
project from the Estimation stage to Closeout. Open the Medical Records
System project page and click the Advance Project icon  on the project toolbar.

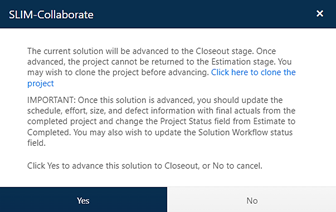
A confirmation message will display, letting you know that advancing a project to the Closeout stage is irreversible. You have the option to clone the Estimation project to preserve the assumptions for comparing to the actual performance and other analysis. Click Yes to advance the project to Closeout and bring up the Closeout project page and dashboard. Note that the project toolbar for Closeout projects is color coded in blue to help you distinguish Closeout projects from Estimation projects (which use pumpkin toolbar elements).
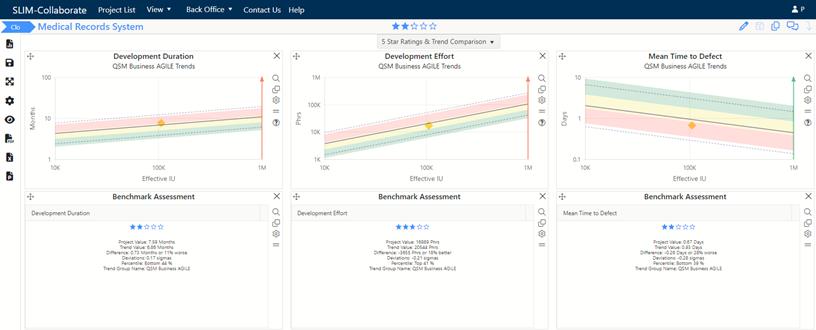
The Closeout Dashboard works much like the Estimate Dashboard. There are fewer options in the project toolbar because the project has completed, and less work is required to update and close out the project. The predefined dashboards support performance benchmarking and analysis, using charts and reports like the Trend and Benchmark Assessment charts shown below.

The data shown on the Closeout Dashboard page reflects the estimate that was just advanced, not the actual project performance. Before he can assess this project’s actual (as opposed to estimated or planned) performance, Phillip must enter the final size, schedule, and effort values for the project.
Click the pencil icon  to enter the project’s final schedule,
effort, size, and other actual data.
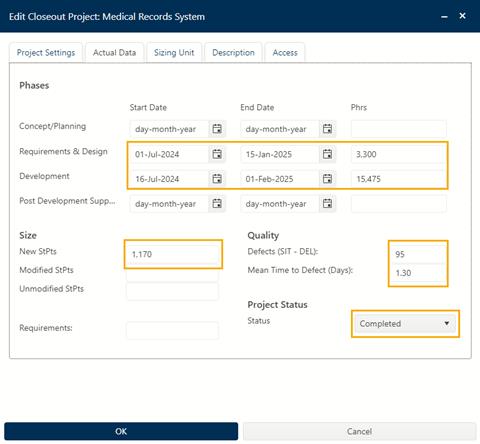
Enter the data shown below on the Actual Data tab:

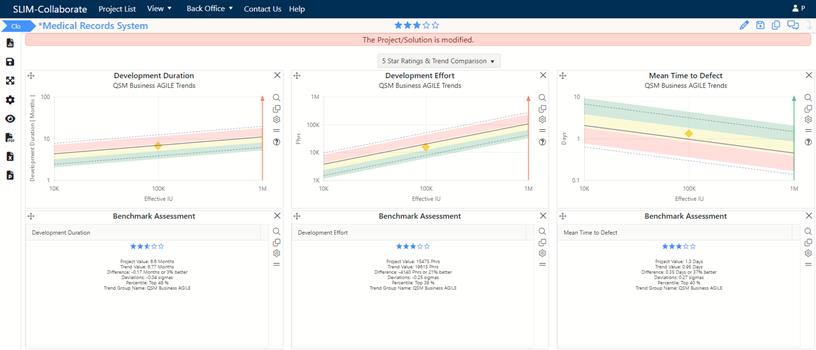
Now that the project actuals have been entered, change the Project Status from Estimate to Completed to show that the estimated size, time, effort, and quality data for this project (advanced from the estimation stage) have been updated to reflect final, actual performance data. This field is used when the project is exported to SLIM-DataManager to ensure that only completed projects are used for performance benchmarking or trend creation. Click OK to calculate the project’s actual performance measures and update the dashboard charts.

The 5 Star Ratings & Trend Comparison dashboard shows trend charts for three core metrics: Duration, Effort, and Mean Time to Defect, SLIM’s measure of software quality. Five Star ratings are computed from the position of each measure relative to the project’s selected trend group, here QSM Business AGILE. The Medical Records release has close to a 3-star rating for each metric, placing it between the 25th and 40th percentiles for QSM Business AGILE projects of the same size.
Phillip would like Ian Stark (his Portfolio Manager) to look at the results using the Portfolio Dashboard. Ian subscribes to email notifications, so he knows the project was advanced to the Closeout stage and the Project Status has been updated to Complete.
Phillip’s work is done on this project, so select Save
Project  icon and select the LogOff User
option via the User Preferences icon and drop-down menu in the upper
right corner of the page to exit SLIM-Collaborate.