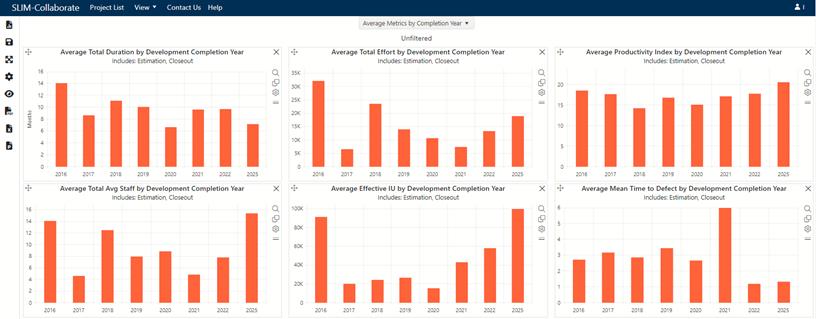
The remaining chart types in the Portfolio Dashboard display a variety of charts that highlight project demographics, such as organization or industry sector, along with project environment data and core performance measures. Executives and managers have immediate access to the latest project intelligence to make timely, data-driven decisions at the program and enterprise levels.
The Portfolio Dashboard displays data for all projects in your Project List, across all stages. Use the sort and filter capabilities on the Project List page to specify the projects to be included in your analysis.
Select dashboard Average Metrics by Completion Year in the DEMOGRAPHICS OVERVIEW folder.

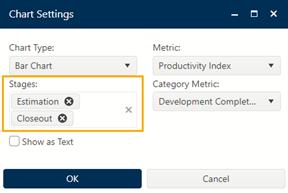
Here, you will see a collection of bar charts that compute average metric values, such as Total Effort, Productivity Index, or Completion Year. Click on the chart settings icon on this and similar chart types to display projects for either Estimation or Closeout stages or both.

You can also easily change the metric type or display the data as text to create a report that can be exported to MS Excel. Take a few minutes to explore some of the other public dashboards that ship with SLIM-Collaborate. Consult the Help to see a complete list of Portfolio chart types and tips for suggested use.
Select Project List on the main menu to close the Portfolio Dashboard and return to the SLIM-Collaborate Home page.