Multiple Project Charts and Reports
Charts and reports showing
multiple projects are available via the Portfolio Dashboard (all project
stages). From the Project List, first create a filter (if desired) to select the
projects you wish to display. For example, you might filter the project
list on a Keyword like “Agile” to see only projects developed using Agile
methods or Stage if you wish to limit chart content to projects in the same
lifecycle stage. To see all projects, leave the list unfiltered. To
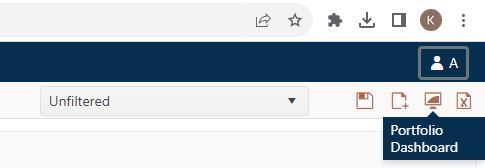
go to the Portfolio dashboard, click the Portfolio Dashboard icon in the
upper right-hand section of the project list page.

The Portfolio Dashboards show all
projects currently displayed in the project list. You can customize any saved
dashboard by changing the chart type and metrics displayed. For more
information on working with portfolio dashboards, see the Portfolio Chart Types topic
in this user guide.
