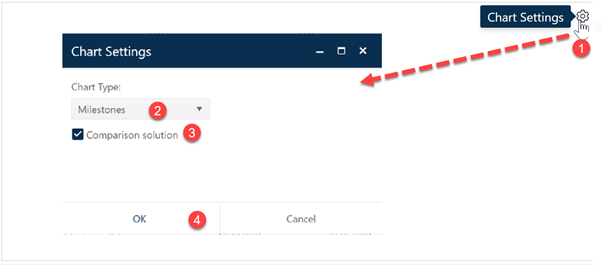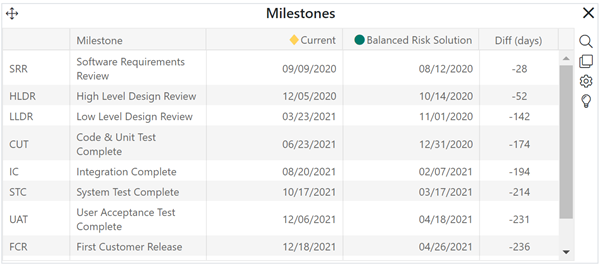
A milestone report shows all active milestones in the current project and the date on which each is expected to occur. There is no “chart” form of this report. Optionally, milestone dates for the comparison solution (or a Contingency solution, if the report is on a Contingency Dashboard) can be displayed for comparison. To create a Milestone report, go to an existing chart or report (or a blank dashboard slot) and click the Chart Settings icon. On the Chart Settings dialog, select Milestones from the Chart Type combo box. The fields available for configuring will update as you select different chart or report types.

The Comparison solution checkbox toggles the display of milestones for the comparison solution on or off. Milestone dates and schedule differences in days will be displayed in addition to the current solution milestone dates.
