To see how the current project positions against its associated trend group and access five-star ratings for effort, schedule, reliability, and overall performance, edit or view the project record, then load the 5 Star Ratings and Trend Comparison dashboard using the Dashboard Selector drop-down located in the center top section of the dashboard . Benchmark assessments for Duration, Effort, and Reliability (MTTD) will be displayed.
Your project will be shown on three graphs that have the normalized effective (new + modified) size on the horizontal axis. Depending on the chart, the vertical axis will show Development (Phase 3) Duration, Phase 3 Effort, or MTTD (Mean Time to Defect). As you pause the cursor over various chart elements, hover tips provide contextual information about the trend lines, shaded regions, and colored arrows along the vertical axis.
Underneath each trend chart is a 5-star chart showing the
following measures:

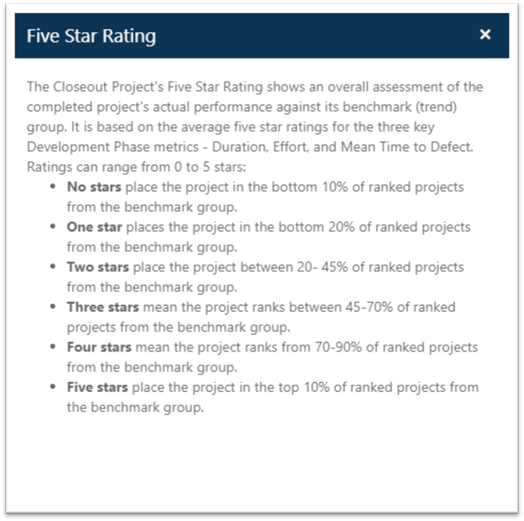
•Five Star Rating. For each closeout project, SLIM-Collaborate
calculates a simple 5-star rating system based on comparable values of the
metric shown in the benchmark trend group:
o No stars place the project in the bottom 10% of ranked projects from the benchmark group.
o One star places the project in the bottom 20% of ranked projects from the benchmark group.
o Two stars place the project between 20- 45% of ranked projects from the benchmark group.
o Three stars mean the project ranks between 45-70% of ranked projects from the benchmark group.
o Four stars mean the project ranks from 70-90% of ranked projects from the benchmark group.
o Five stars place the
project in the top 10% of ranked projects from the benchmark group.
•Project Value: This field displays the value of the metric on the
vertical axis (P3 duration, effort, or MTTD) for the project.
•Baseline Value: This field displays the average metric value from
the benchmarking trend (P3 duration, effort, or MTTD) at the same size as the
completed project.
•Difference: The difference between the Project and Baseline values
will display both the absolute difference (a numeric value, such as 6.3 months
duration) and the percentage difference (24% worse) relative to the trend.
•Deviations: This metric tells you how far each project positions
(in standard deviations or sigmas) from the average benchmark trend
line.
•Percentile: This field provides a percentile rank for each
project against the benchmark reference group.
•Trend Group. Identifies the benchmark trend group specified in the project settings. This is the data used to calculate the project’s percentile rank and five-star rating for various metrics.
An overall (averaged) five-star rating for the project is in the project toolbar to the right of the project name.

The overall rating is calculated by averaging the five-star
ratings for Duration, Effort, and MTTD. Like any average, the overall rating can
be influenced by very high (5 star) or very low (1 star) ratings for
duration/effort/schedule. Used in combination with the individual metric
assessments, the composite rating provides a useful high-level assessment of
overall project performance. Clicking on the overall 5-star rating in the
project toolbar brings up a tooltip listing the definitions for each
rating.