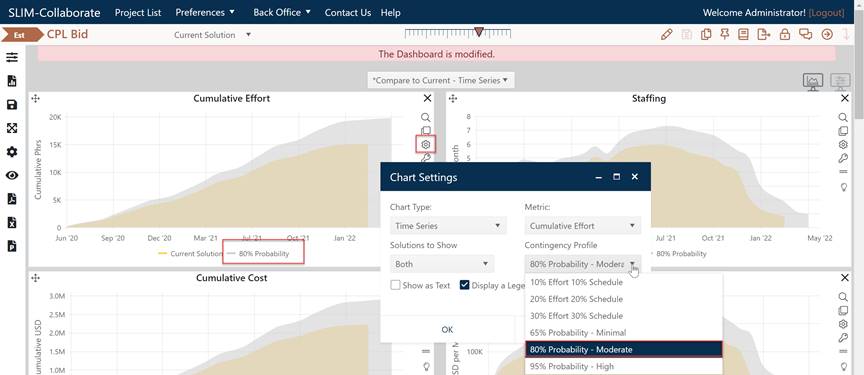
Once you have adjusted the uncertainty sliders and created
the range of solutions shown on the Probability Charts, displaying the resulting
target probability solutions is easy! The preconfigured target probability
profiles created by your Back Office administrator are available for selection
on the following charts and reports available on the Contingency
dashboard:
•Time Series
•Trend
•Milestone
•Summary
To display a target probability profile, simply select the target probability profile with your desired assurance level from the Contingency Profiles field in the chart properties of any chart or report. Most probability based contingency profiles will have “probability” or a “% assurance” in the profile name.

Note that the % assurance for each profile will match the corresponding value shown on the probability chart for the project. So, for instance, if you select the 95% probability profile and display duration on a time series chart, the duration contingency solution will match the 95% assurance value from the duration probability chart and report.
Using the Solutions to Show field in the chart properties, you can opt to display just the current solution, just the contingency solution, or both the current and contingency solutions. This last option allows you to compare the current and risk buffered solutions on the same chart.