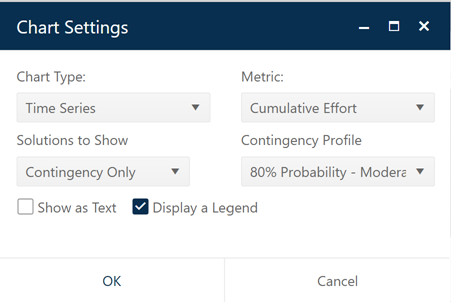
Two additional fields are available on time series charts displayed on Contingency dashboards.

Use the Solutions to Show field to display the current solution only, contingency solution only, or both current and contingency solutions. When you click the Contingency Profile drop-down selection list, a list of all active Contingency Profiles supplied by your Back Office administrator will appear. For detailed guidance on the types of contingency profiles, see What Is a Contingency Profile?.
Note: due to slight differences between the way rate values and displayed and computed in SLIM-Collaborate vs. SLIM-Suite desktop applications, you may notice minor variations in reported monthly rate values between time series reports exported from SLIM-Collaborate and comparable reports exported from SLIM-Suite desktop applications. In most cases, the difference between the two methods is negligible, except for very short phases or phases where the peak occurs during a partial month.