SLIM’s Software Production Equation uses Size and PI estimates to compute the nonlinear tradeoff between Time and Effort. The equation can be rearranged to compute different estimate scenarios or strategies, known as Solution Methods. Four Solution Methods are provided in SLIM-Collaborate:
•Trend Based - reflects average schedule and effort performance for projects of the same size from the project’s trend group.
•Design to Goal - creates a solution using your estimated system size and productivity, plus a single duration, effort, staff, or cost goal.
•Feasibility - produces early ROM estimates using high-level size inputs, plus your desired schedule and staff/effort/cost goals.
•Time Boxed, Fixed Team - estimates how much functionality (size) can be delivered, given a specified schedule, effort/staff, and productivity. This method is often used for Agile development.
See the How to Create an Estimate support video tutorial to learn more about solution methods.
Phillip’s Feasibility estimate computed the productivity required to execute the Sales team’s proposal. Now that he has sanity-checked the estimate against Rintell’s history and entered the updated size estimate, Phillip would like to run a solution to determine the effort required to meet a 7, rather than 6-month schedule, given the size is larger than the t-shirt estimate. He would also like to base it on the industry average productivity, since the PI required to meet the sales proposal is higher than the industry average.
Go to the Assumptions tab.

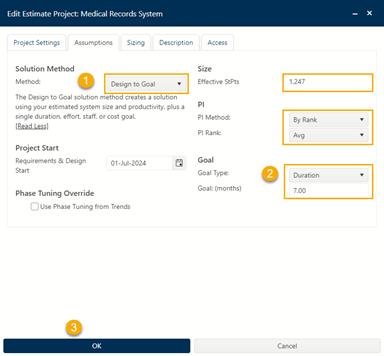
Select Design to Goal in the Solution Method options area. Notice that the size shows the updated estimate of 1247 Effective StPts and the solution inputs on the right-hand side of the dialog have been updated to match your new solution method. The default options for PI are By Rank and Avg – using the PI from the QSM Business AGILE trend group for projects the same size. For Goal Type select Duration and enter 7 months for the Duration goal. Click OK to compute the estimate and view the results on the dashboard.
Once you have used the project dashboard, SLIM-Collaborate displays the last dashboard used unless you have designated a favorite. If it is not already displayed, select the FEASIBILITY ASSESSMENT dashboard.

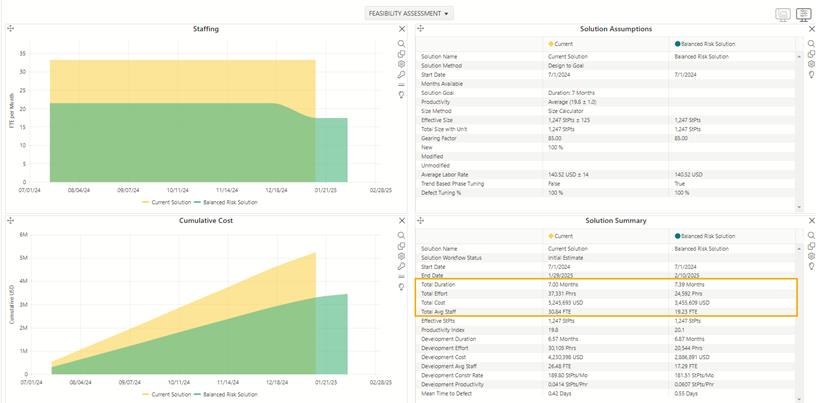
The revised assumptions (larger size estimate and typical PI) produce a dramatic increase in the effort and cost required to deliver the new system one month later - at least double! The Balanced Risk Solution requires 20 people but will take 7.39 months. Phillip would like to find a more acceptable solution that balances project goals and potential risk. He would like to see how using 15 people would affect the project schedule. But first, he needs to log this solution.
Use the push pin icon  to add the current solution to
the log and accept the default name. Click on the Solution Log
icon
  . The solution log now contains two
estimates: 1) the early Feasibility solution and 2) Phillip’s 7-month,
time constrained solution.

You can edit the solution log Name, Notes, or Workflow Status to provide descriptive information that fits your situation or highlights important differences between solutions and use the arrow icon to make a solution current. Click on the pencil icon for Sol 2: Design to Goal of 6 Months to modify the Solution Notes and enter the following:
“Entered the detailed size estimate, set the duration to
7 months, and assumed average productivity.” Click the
checkmark  on the right-hand side to save
your changes and click OK to close the Solution Log.
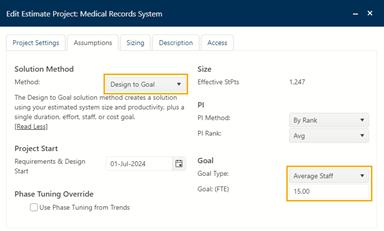
Click on the pencil icon  to edit the project. On the
Assumptions tab, change the Goal Type to Average Staff, 15 FTEs on
the Assumptions tab. Click OK to generate a new
solution.

Phillip is glad to see that the overall risk rating changed from Moderately Risky to Typical. Select dashboard ESTIMATE ASSESSMENT to view some trend and risk charts. Phillip would like to modify the dashboard to include staffing and defect comparison charts to make a case for his recommended solution.